Example: Observation Planning
This example outlines a common use case for coordinate transformations:
observability curves to assist planning or executing an observing run.
This serves to demonstrate typical usage of SkyCoord
and the transformation framework.
Let’s suppose you are planning to visit picturesque
Bear Mountain State Park in New York, USA.
You’re bringing your telescope with you (of course), and someone told you M33 is
a great target to observe there. You happen to know you’re free at 11:00 pm
local time, and you want to know if it will be up. Astropy can answer that.
In the example below, we make a SkyCoord to look up
the coordinates of M33 online, and then transform to horizontal coordinates
(AltAz) using an astropy.time.Time object for when
we’re observing and an EarthLocation object for the
park:
>>> import numpy as np
>>> from astropy import units as u
>>> from astropy.time import Time
>>> from astropy.coordinates import SkyCoord, EarthLocation, AltAz
>>> m33 = SkyCoord.from_name('M33')
>>> bear_mountain = EarthLocation(lat=41.3*u.deg, lon=-74*u.deg, height=390*u.m)
>>> utcoffset = -4*u.hour  # Eastern Daylight Time
>>> time = Time('2012-7-12 23:00:00') - utcoffset
>>> m33altaz = m33.transform_to(AltAz(obstime=time,location=bear_mountain))
>>> "M33's Altitude = {0.alt:.2}".format(m33altaz)
"M33's Altitude = 0.13 deg"
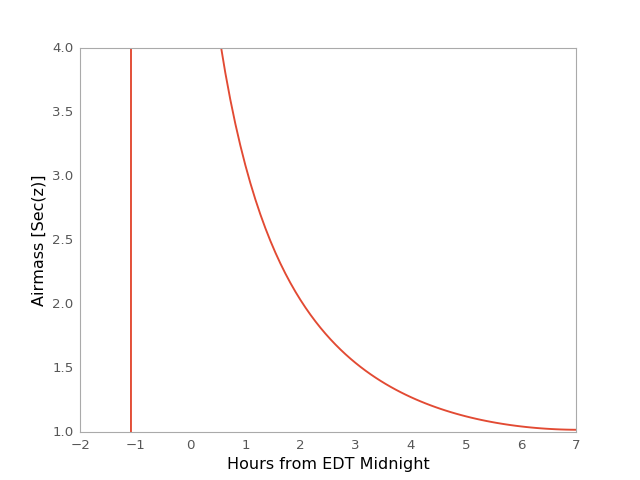
Oops, so low of an altitude indicates M33 is only just rising, so the trees and mountains will be in the way. You’d better make a plot to see what the night is going to look like. We’ll do it by airmass, too, because that’s a better measure of telescope observing conditions:
>>> midnight = Time('2012-7-13 00:00:00') - utcoffset
>>> delta_midnight = np.linspace(-2, 7, 100)*u.hour
>>> m33altazs = m33.transform_to(AltAz(obstime=midnight+delta_midnight, location=bear_mountain))
>>> import matplotlib.pyplot as plt
>>> plt.plot(delta_midnight, m33altazs.secz)
>>> plt.xlim(-2, 7)
>>> plt.ylim(1, 4)
>>> plt.xlabel('Hours from EDT Midnight')
>>> plt.ylabel('Airmass [Sec(z)]')
(Source code, png, hires.png, pdf)
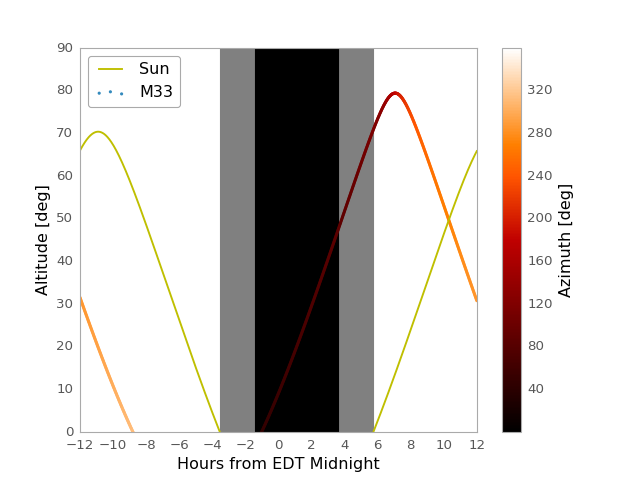
Hmm, looks like you may need to stay up pretty late. But maybe you’re an
early-riser? Then you need to know when the sun is rising, and when
it will be twilight. We can get the sun’s location with
get_sun and then plot the altitude and color-code by
azimuth:
>>> from astropy.coordinates import get_sun
>>> delta_midnight = np.linspace(-12, 12, 1000)*u.hour
>>> times = midnight + delta_midnight
>>> altazframe = AltAz(obstime=times, location=bear_mountain)
>>> sunaltazs = get_sun(times).transform_to(altazframe)
>>> m33altazs = m33.transform_to(altazframe)
>>> plt.plot(delta_midnight, sunaltazs.alt, color='y', label='Sun')
>>> plt.scatter(delta_midnight, m33altazs.alt, c=m33altazs.az, label='M33', lw=0, s=8)
>>> plt.fill_between(delta_midnight.to('hr').value, 0, 90, sunaltazs.alt < -0*u.deg, color='0.5', zorder=0)
>>> plt.fill_between(delta_midnight.to('hr').value, 0, 90, sunaltazs.alt < -18*u.deg, color='k', zorder=0)
>>> plt.colorbar().set_label('Azimuth [deg]')
>>> plt.legend(loc='upper left')
>>> plt.xlim(-12, 12)
>>> plt.xticks(np.arange(13)*2 -12)
>>> plt.ylim(0, 90)
>>> plt.xlabel('Hours from EDT Midnight')
>>> plt.ylabel('Altitude [deg]')
(Source code, png, hires.png, pdf)

Now you’re fully-equipped with the tools you need to plan your next observing run... Or have a proper vacation. You decide!