Sersic2D
-
class
astropy.modeling.functional_models.Sersic2D[source] [edit on github]¶ Bases:
astropy.modeling.Fittable2DModelTwo dimensional Sersic surface brightness profile.
Parameters: amplitude : float
Central surface brightness, within r_eff.
r_eff : float
Effective (half-light) radius
n : float
Sersic Index.
x_0 : float, optional
x position of the center.
y_0 : float, optional
y position of the center.
ellip : float, optional
Ellipticity.
theta : float, optional
Rotation angle in radians, counterclockwise from the positive x-axis.
Other Parameters: fixed : a dict
A dictionary
{parameter_name: boolean}of parameters to not be varied during fitting. True means the parameter is held fixed. Alternatively thefixedproperty of a parameter may be used.tied : dict
A dictionary
{parameter_name: callable}of parameters which are linked to some other parameter. The dictionary values are callables providing the linking relationship. Alternatively thetiedproperty of a parameter may be used.bounds : dict
eqcons : list
A list of functions of length
nsuch thateqcons[j](x0,*args) == 0.0in a successfully optimized problem.ineqcons : list
A list of functions of length
nsuch thatieqcons[j](x0,*args) >= 0.0is a successfully optimized problem.See also
Notes
Model formula:
\[I(x,y) = I(r) = I_e\exp\left[-b_n\left(\frac{r}{r_{e}}\right)^{(1/n)}-1\right]\]The constant \(b_n\) is defined such that \(r_e\) contains half the total luminosity, and can be solved for numerically.
\[\Gamma(2n) = 2\gamma (b_n,2n)\]References
[R8] http://ned.ipac.caltech.edu/level5/March05/Graham/Graham2.html Examples
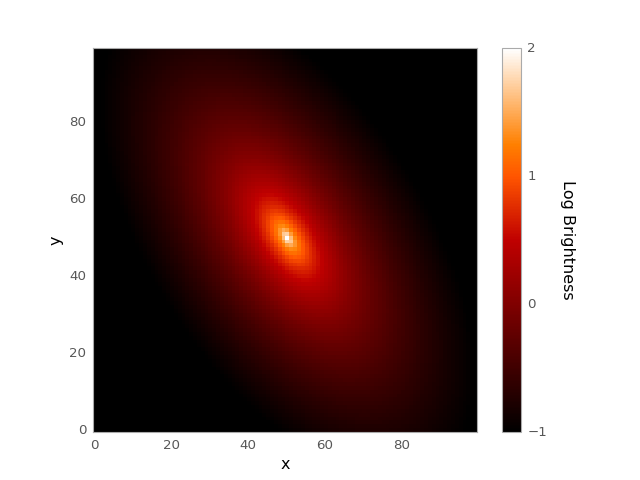
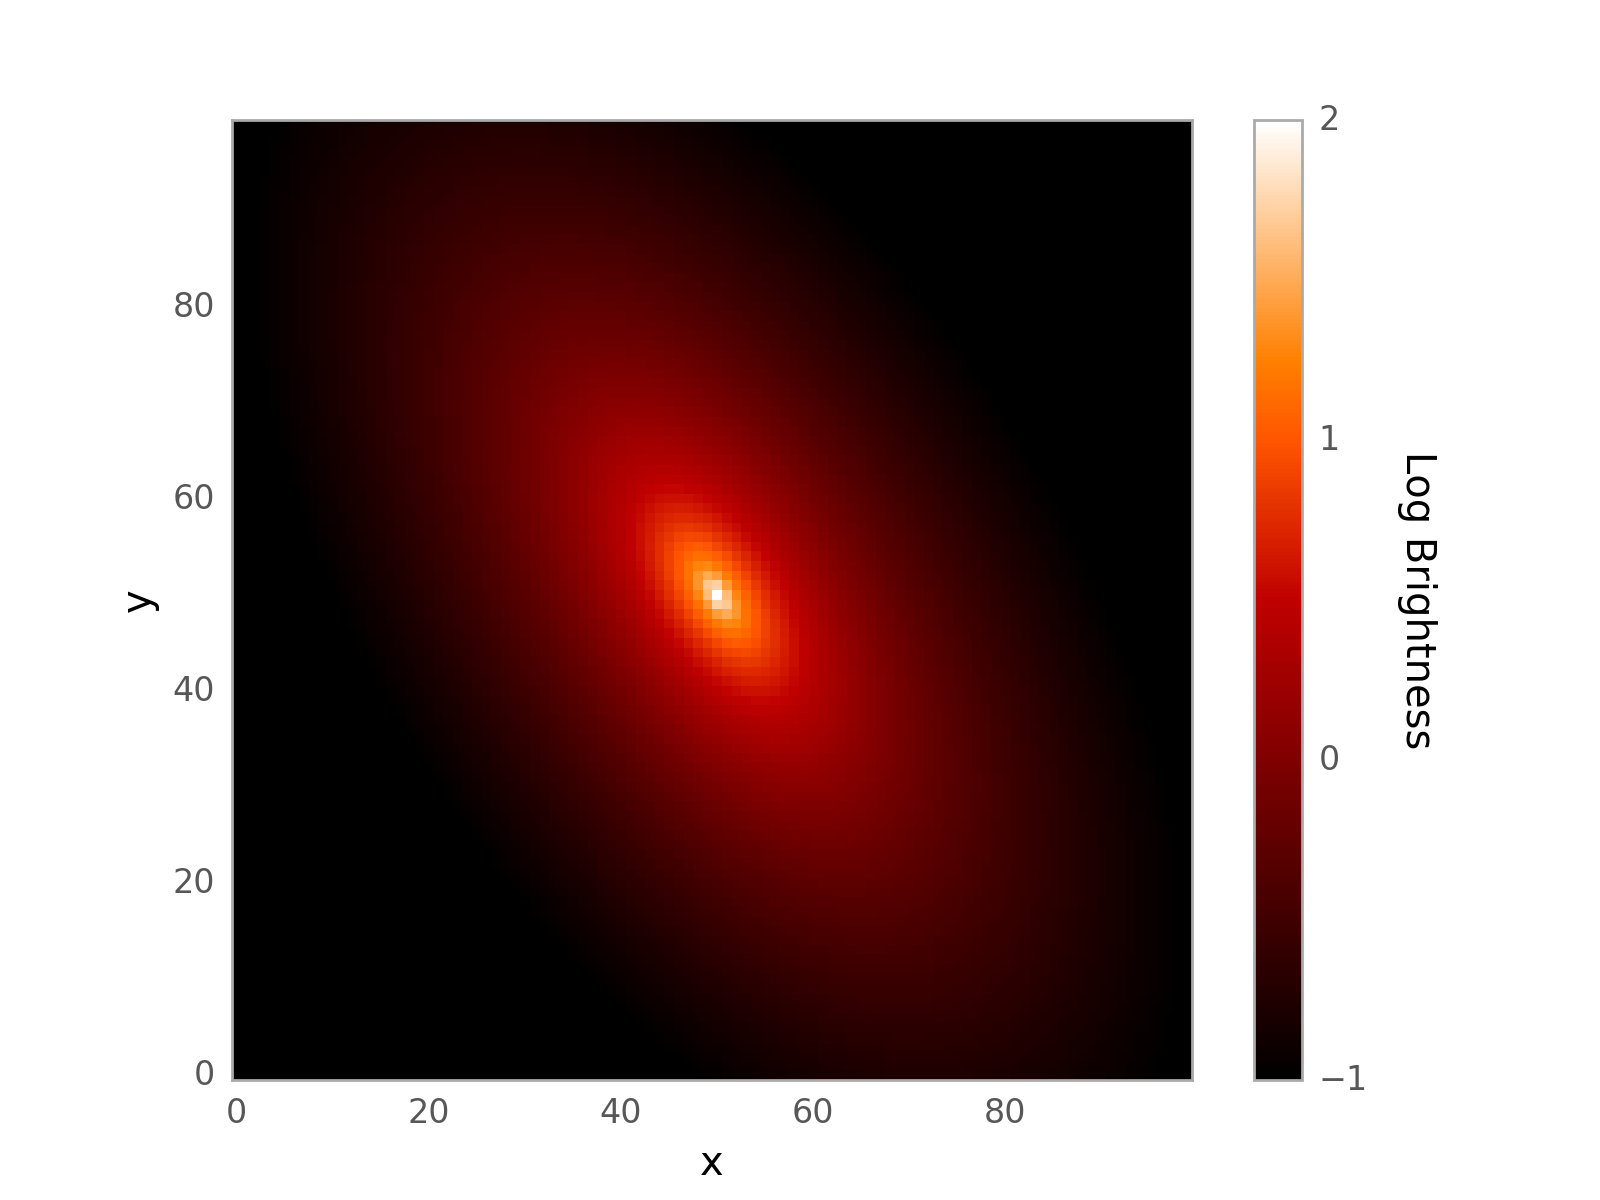
import numpy as np
from astropy.modeling.models import Sersic2D
import matplotlib.pyplot as plt

x,y = np.meshgrid(np.arange(100), np.arange(100))

mod = Sersic2D(amplitude = 1, r_eff = 25, n=4, x_0=50, y_0=50,
               ellip=.5, theta=-1)
img = mod(x, y)
log_img = np.log10(img)

plt.figure()
plt.imshow(log_img, origin='lower', interpolation='nearest',
           vmin=-1, vmax=2)
plt.xlabel('x')
plt.ylabel('y')
cbar = plt.colorbar()
cbar.set_label('Log Brightness', rotation=270, labelpad=25)
cbar.set_ticks([-1, 0, 1, 2], update_ticks=True)
plt.show()
(Source code, png, hires.png, pdf)

Attributes Summary
amplitudeellipnparam_namesr_effthetax_0y_0Methods Summary
evaluate(x, y, amplitude, r_eff, n, x_0, ...)Two dimensional Sersic profile function. Attributes Documentation
-
amplitude
-
ellip
-
n
-
param_names= ('amplitude', 'r_eff', 'n', 'x_0', 'y_0', 'ellip', 'theta')
-
r_eff
-
theta
-
x_0
-
y_0
Methods Documentation
-
classmethod
evaluate(x, y, amplitude, r_eff, n, x_0, y_0, ellip, theta)[source] [edit on github]¶ Two dimensional Sersic profile function.
-